ENGINEERING NOTE / 09 SQL SERVERPOSTGRESQLMARIADBSCYLLADBARCHITECTURE
From Daily Checks to a Database Engineering Command Center
It started as a way to stop running the same checks by hand. The interesting engineering began when the monitoring system itself needed a work queue, ownership, recovery, inventory discovery and a path toward safe management actions — and the whole thing was specified by me and built with AI as the implementation engine.
TABLE OF CONTENTS
- Make the routine disappear
- One process should not own the whole estate
- Claiming work is not enough — ownership matters
- Metrics became the contract between collectors and operations
- The AI health report is a filter with a model on the end
- Inventory discovery was the point where monitoring became management
- The control surface is still evolving
- How it was built: my design, AI as the implementation engine
- Takeaway
The starting point was ordinary database operations work: check whether services are up, confirm backups, look for replication problems, inspect disk space, review jobs, and repeat the same process across several database engines.
The estate included SQL Server, PostgreSQL, MariaDB and ScyllaDB. The old process depended on several tools, manual sessions and engine-specific scripts. It produced a snapshot once a day, had almost no useful historical context, and naturally developed coverage gaps whenever the person doing the checks was unavailable.
The obvious answer was “automate the checks.” That was necessary, but it was not the interesting part.
A single script can automate one check. A platform that continuously inspects a heterogeneous database estate has to answer a different class of question: what is the source of truth for inventory, how does work get distributed once one collector is no longer enough, what happens if a worker dies mid-check, how do two workers avoid duplicating the same work, which metadata belongs in a metric label, how does a new endpoint enter the system without someone hand-editing configuration — and what changes the moment the same surface starts doing more than observing?
Those questions are what turned a collection of scripts into a small distributed system.
Make the routine disappear§
The first version replaced a human, once-a-day workflow with collectors running on a short interval and exporting Prometheus-compatible metrics into Grafana.
-
01 BEFORE
Engine-specific tools, a manual connection per endpoint, run checks, interpret output, repeat.
-
02 AFTER CONFIRMED
Inventory drives scheduled work; engine-specific collectors export Prometheus metrics into Grafana; a human reviews anomalies.
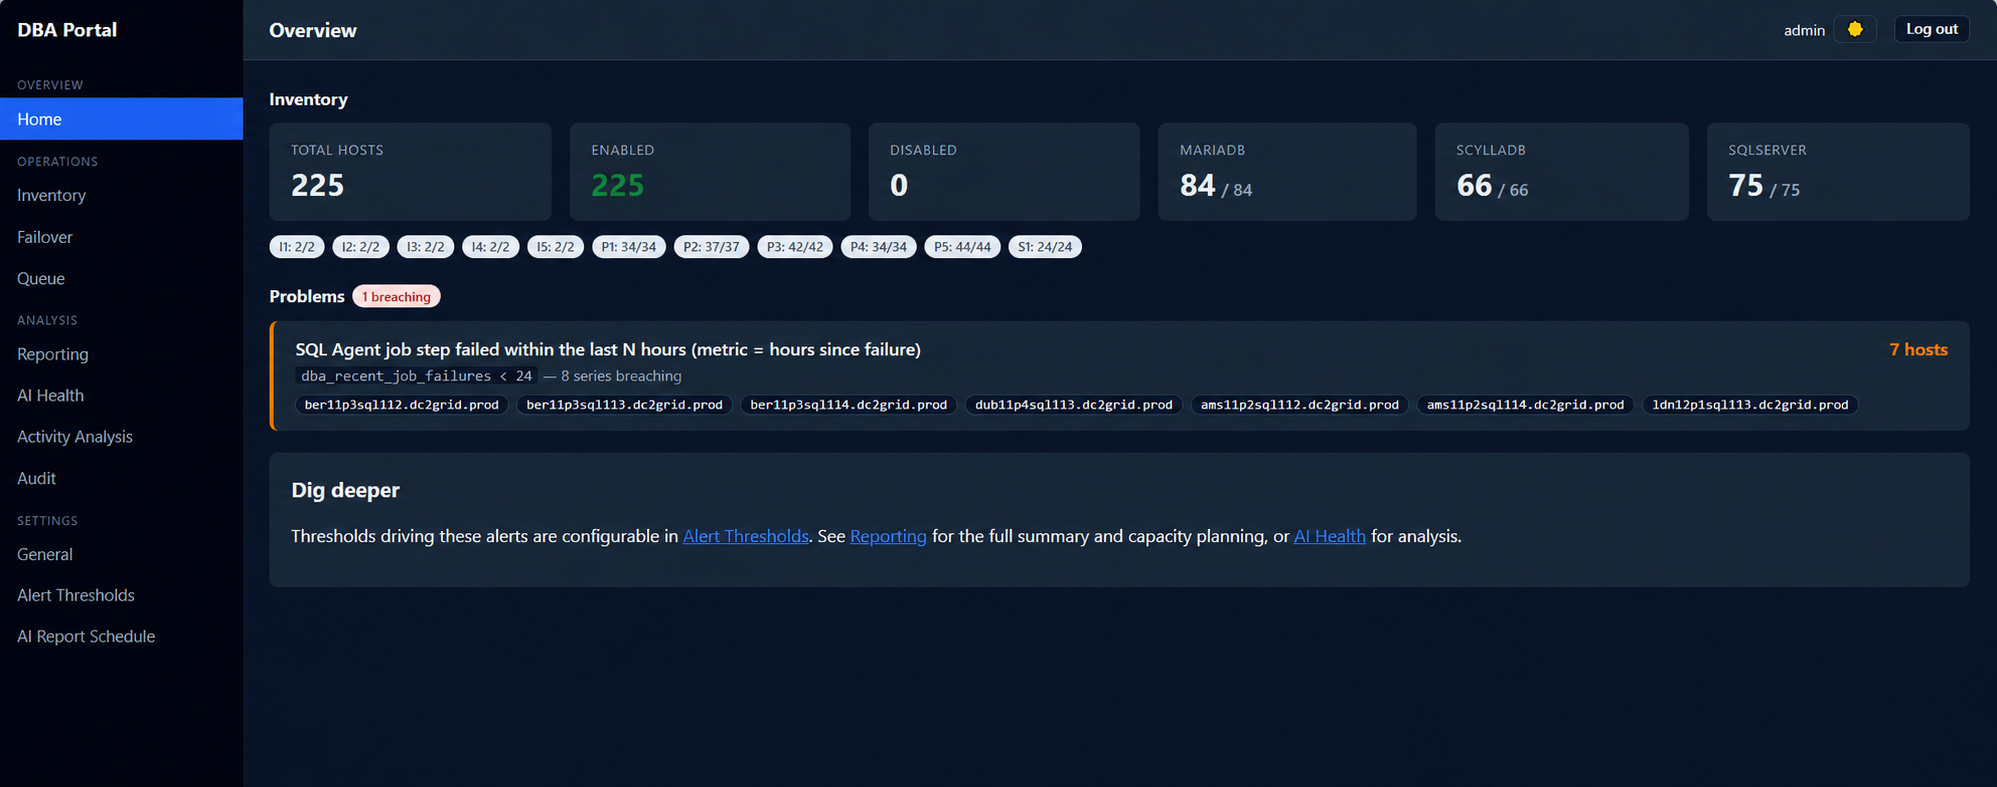
The direct time saving was real: the manual round had been taking roughly two hours of focused DBA time every day, and it became a short anomaly review over a page that had already done the looking.
But the operational change was larger than the two hours. The detection window moved from “someone looked today” to a regular automated interval, and engines that previously had weaker coverage entered the same operating model.
The distribution model changed with it. The daily round had belonged to whoever was on call — one person, looking, and everyone else finding out later if at all. The report is now generated on a schedule and posted straight into the team’s Microsoft Teams channel. Estate health stopped being something one engineer went and fetched, and became something the whole team receives, at the same time, in a place they already are.
- DBA TIME RECLAIMED
- ≈2 h/day
- WHO GETS THE REPORT
- the team
- DELIVERY
- Teams
That last one matters more than it sounds. A report someone has to go and open is a report that gets opened when someone remembers. A report that arrives where the team already talks is one that gets read, questioned and picked up — and any engineer, not only the on-call one, can take an item.
The platform also had a second purpose: lower the barrier for the rest of the database team to contribute automation and experiment with AI-assisted operational workflows. Instead of every engineer having to assemble inventory access, execution plumbing, metrics and a UI around each new idea, the portal gave the team a shared engineering surface to build on.
That solved the workflow problem. It also exposed the next scaling problem.
One process should not own the whole estate§
Once the number and variety of checks increased, I did not want collection throughput to depend on one long-running process iterating through the full inventory.
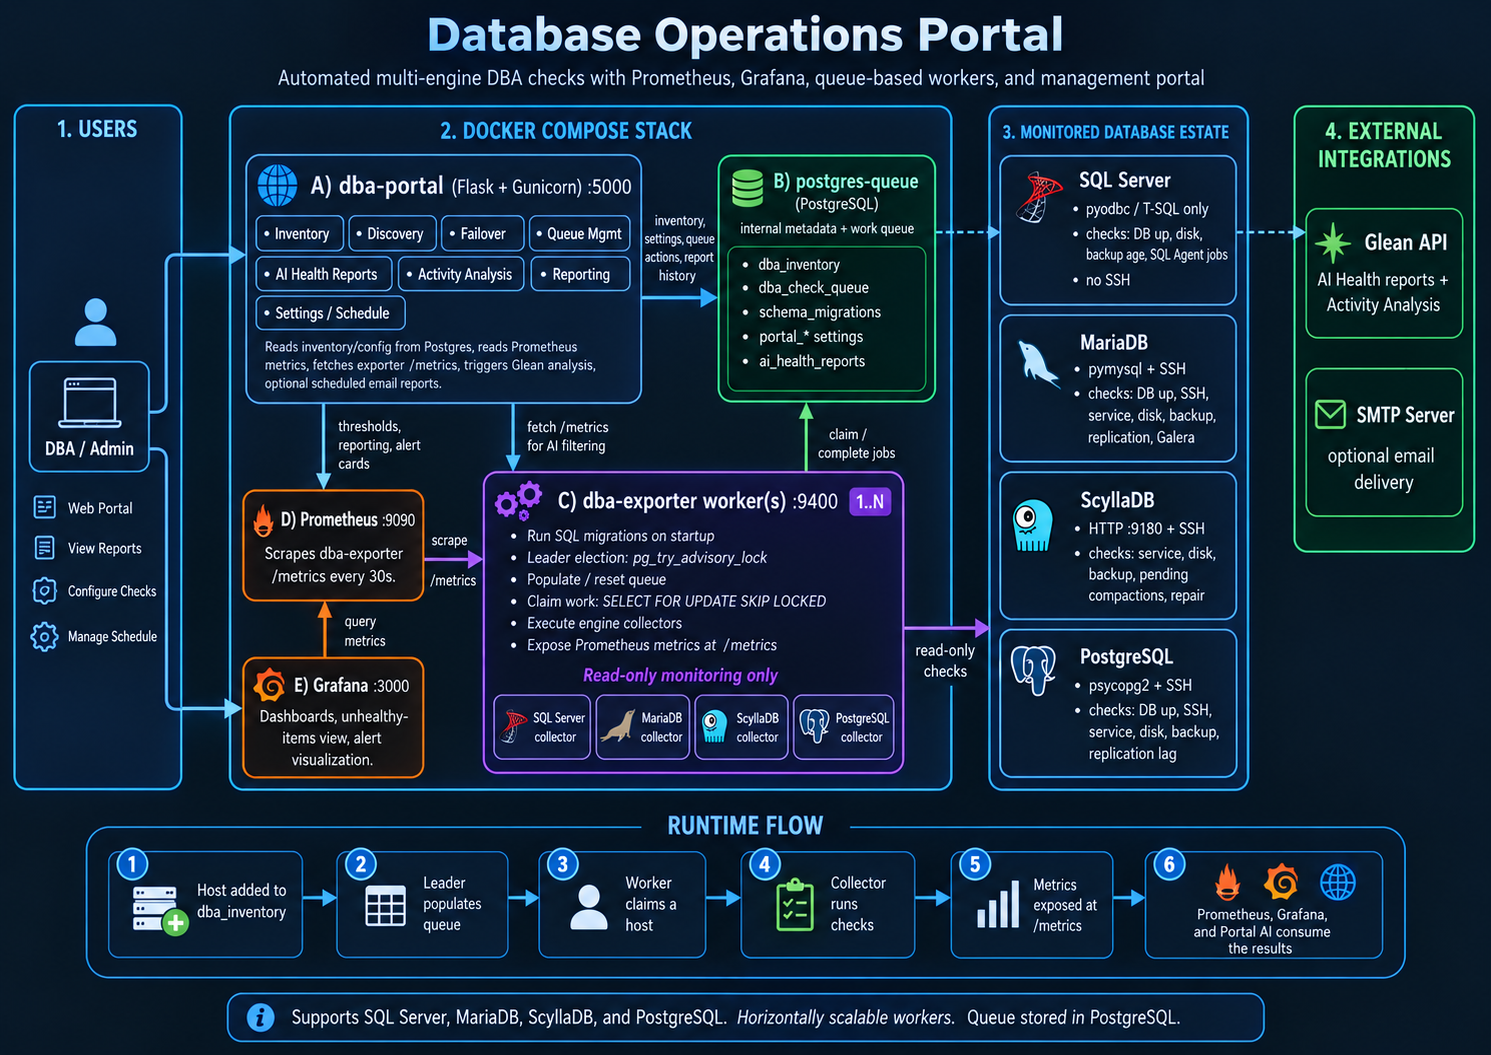
PostgreSQL became the coordination layer. At a high level, the schema contains an inventory and a queue of checks to perform. Workers claim work with the standard pattern:
SELECT ...
FROM check_queue
WHERE state = 'pending'
ORDER BY created_at
FOR UPDATE SKIP LOCKED
LIMIT 1;
SKIP LOCKED matters because workers do not need to negotiate with each
other in application code. Each worker asks PostgreSQL for the next
claimable row; rows already locked by another worker are skipped. Adding a
worker increases collection capacity without changing collector logic.
The row is selected and its ownership state is updated in the same short transaction. The database row lock protects the atomic claim; the persisted owner and state protect ownership after that transaction commits. Those are two different guarantees, and the second is what lets the worker continue to own the work after the lock itself is gone.
The scheduler itself uses a PostgreSQL advisory lock so that only one scheduler instance performs the scheduling role at a time — a leader election cheap enough not to justify a separate coordination service for this amount of work.
Claiming work is not enough — ownership matters§
The first queue design still had a failure mode: a work item being “in progress” did not by itself make completion ownership explicit. With multiple workers, the system needs to distinguish this check is running from this specific worker owns this claim and is the only worker allowed to complete it.
The queue was changed so a worker records its identity when it claims an item. Completion is ownership-aware — a different worker cannot mark that item complete. There is also stale-claim recovery: if a worker disappears while holding work, the item cannot remain permanently stranded. Old claims become eligible for recovery after a bounded timeout.
-
01 PENDING
A check is eligible and unclaimed.
-
02 CLAIM
A worker records its own identity as owner and moves the item to RUNNING.
-
03 RUNNING → COMPLETE
The owning worker, and only the owning worker, marks the item complete.
-
04 OWNER DISAPPEARS OBSERVED
The claim goes stale after a bounded timeout and returns to PENDING.
The important part is not the exact timeout. It is that failure recovery is part of the queue’s own semantics rather than an operational instruction that says “restart the worker if it gets stuck.”
Metrics became the contract between collectors and operations§
Each database engine has different native concepts, but operations needs a common vocabulary. The metrics layer normalises signals such as connectivity, service state, disk capacity, backup health, replication state, scheduled jobs and engine-specific cluster health. Labels carry dimensions such as engine, endpoint, environment and operational role.
That abstraction is useful because the dashboard does not need to understand how SQL Server, PostgreSQL, MariaDB or ScyllaDB obtained a particular signal. The collector owns engine semantics; the metrics layer owns the operational contract.
The AI health report is a filter with a model on the end§
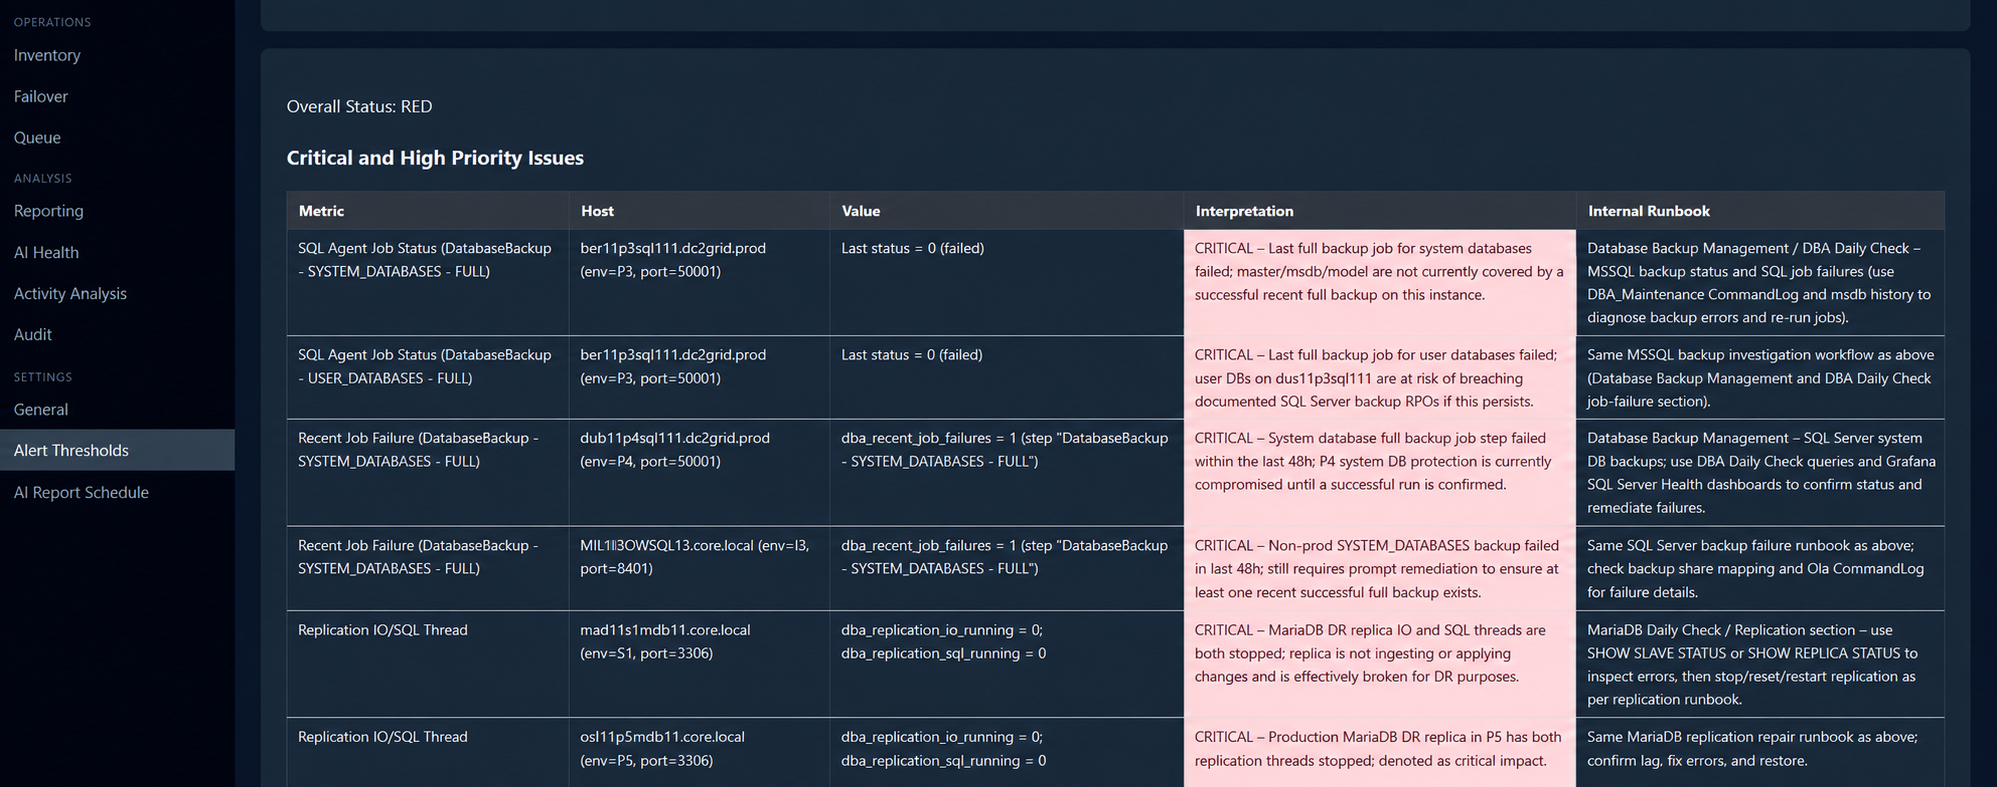
The normalised metrics layer is also what made a language model useful here rather than merely impressive. A scheduled job produces a written health report for the estate and posts it to the team — but the interesting design decision is what the model is allowed to see.
The naive version of this feature ships a dashboard’s worth of metrics into a prompt every morning and asks for a summary. That is the version that gets expensive, slow and vague at exactly the same time.
Instead, thresholds are evaluated first, deterministically, before any model is involved. Rules decide what counts as breaching. Only the breaching series — plus the small amount of identity a human needs to act on them: engine, endpoint, environment, operational role — are assembled into the payload. The model receives an exception set, not an estate.
Three things follow from that boundary, and each of them was worth the restraint:
Signal. A model asked to find the anomaly inside thousands of healthy rows will either bury the real one or invent a plausible one. Given only what already breached, it has nothing to hallucinate a problem out of — the findings are constrained to metrics that a human can go and check.
Cost and latency stay bounded. Context is a budget, and the estate is not a fixed size. Tying the request to the breach count rather than the inventory count is what keeps a scheduled job predictable as the estate grows.
Reviewability. Every statement in the report traces back to a specific metric on a specific endpoint at a specific time. That is what makes the output something an engineer can disagree with, which is the minimum bar for letting generated text into an operational channel.
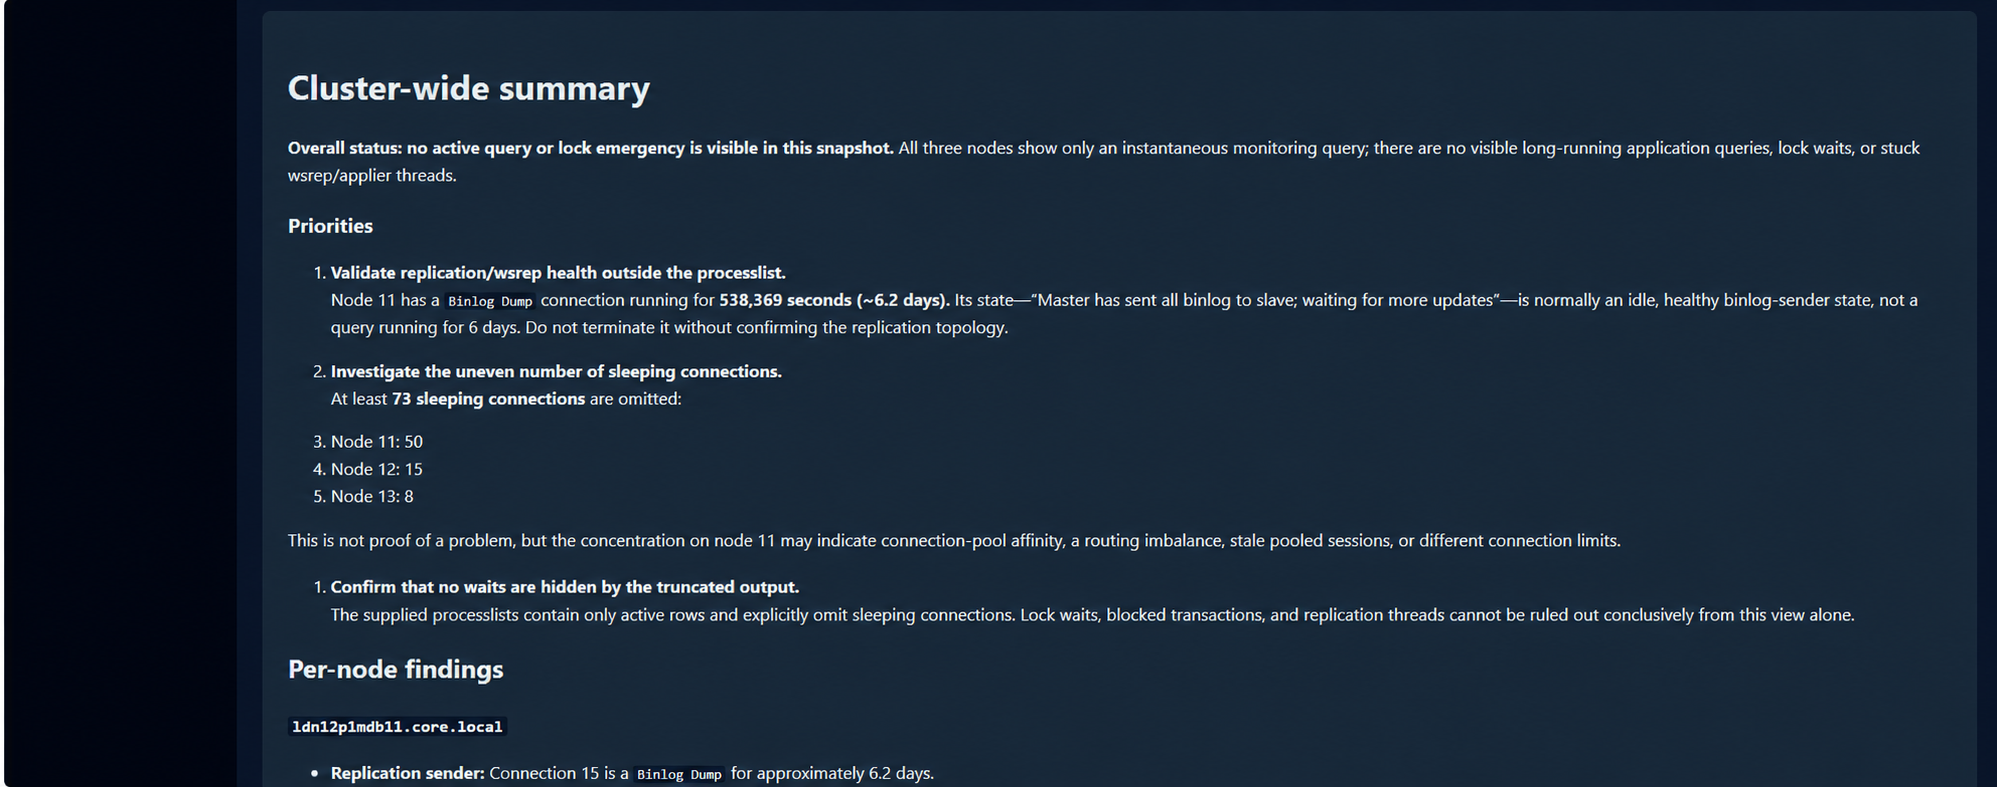
The same discipline shows up in the on-demand path. Activity Analysis lets an engineer pick hosts from the product and environment tree and take live snapshots in parallel.
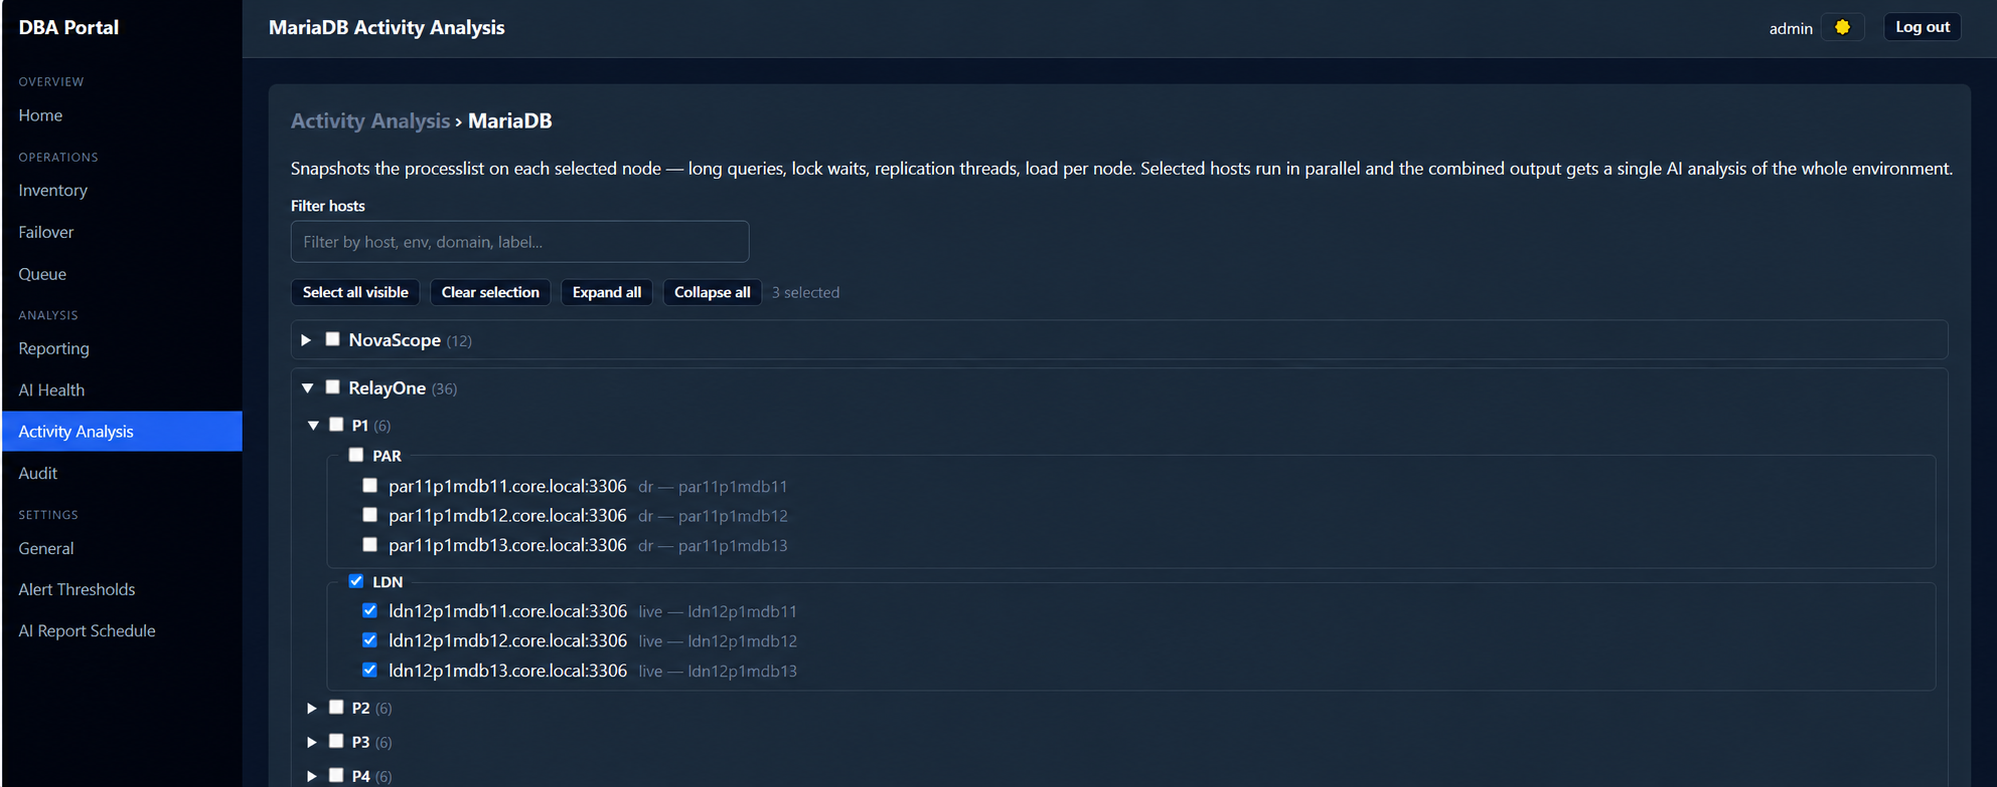
The snapshots are collected by the platform, combined, and then read once — one pass over the assembled picture, returning priorities first and per-node findings after — rather than a conversation per host that pays for the same background context again and again.
Inventory discovery was the point where monitoring became management§
The system originally assumed that inventory already existed. That eventually became too manual, so I added a discovery/onboarding flow to the portal: an operator submits a candidate endpoint, and the platform runs a verification pipeline before adding it to inventory.
The public version of that flow is intentionally simplified:
- Candidate endpoint submitted by an operator.
- Derive approved metadata for the endpoint.
- Probe the expected listener.
- Attempt real engine authentication — an actual database-level login with the appropriate engine driver, not just a TCP handshake.
- Validate engine context.
- Create the inventory entry.
A successful network connection is not enough — a port being open only proves that something answered. The discovery flow performs an actual database connection before accepting an endpoint, which catches the case where DNS resolves and a listener exists but the endpoint is not a usable target for the platform.
That was a subtle architectural shift. The portal was no longer merely reading metrics about a preconfigured estate; it had started to participate in the lifecycle of that estate by verifying and onboarding resources into it.
The control surface is still evolving§
That is why I now think of it less as a “DBA dashboard” and more as a database engineering command centre. Monitoring remains the foundation, but new operational-management capabilities are being added around the same inventory and execution model — and that changes the design requirements. A monitoring bug can produce a bad graph. A management bug can change a production system.
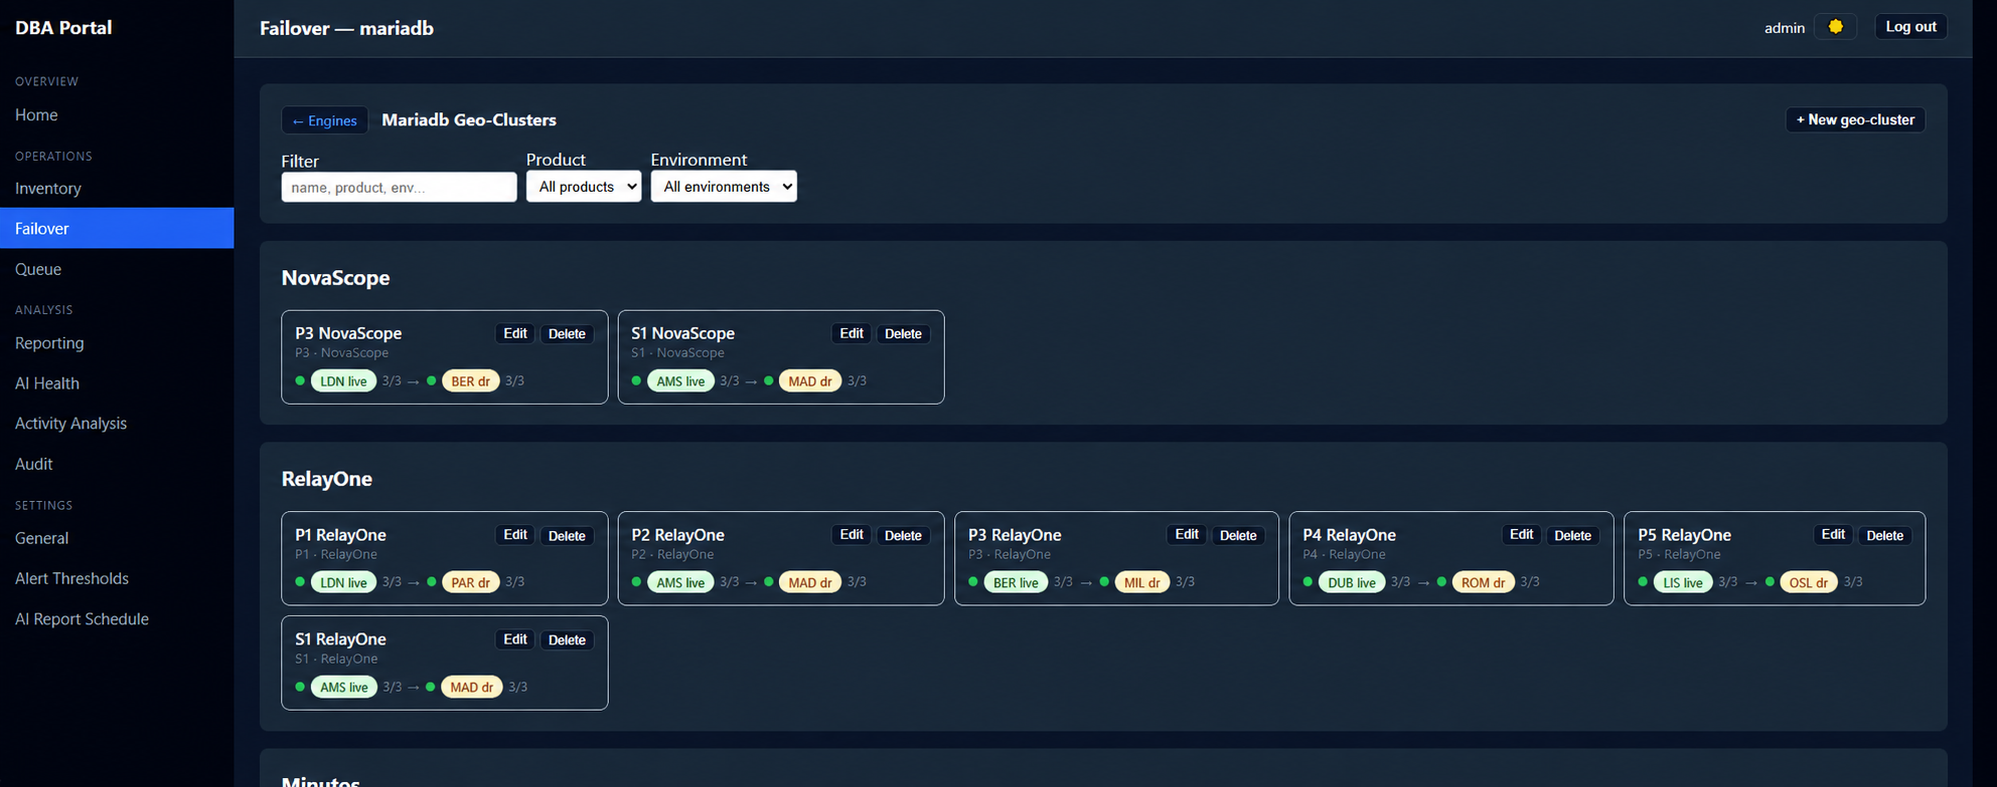
The geo-failover surface is where that shift is easiest to see. It starts as observation — a tile per product, live and DR sites, health overlaid from the same Prometheus metrics everything else reads.
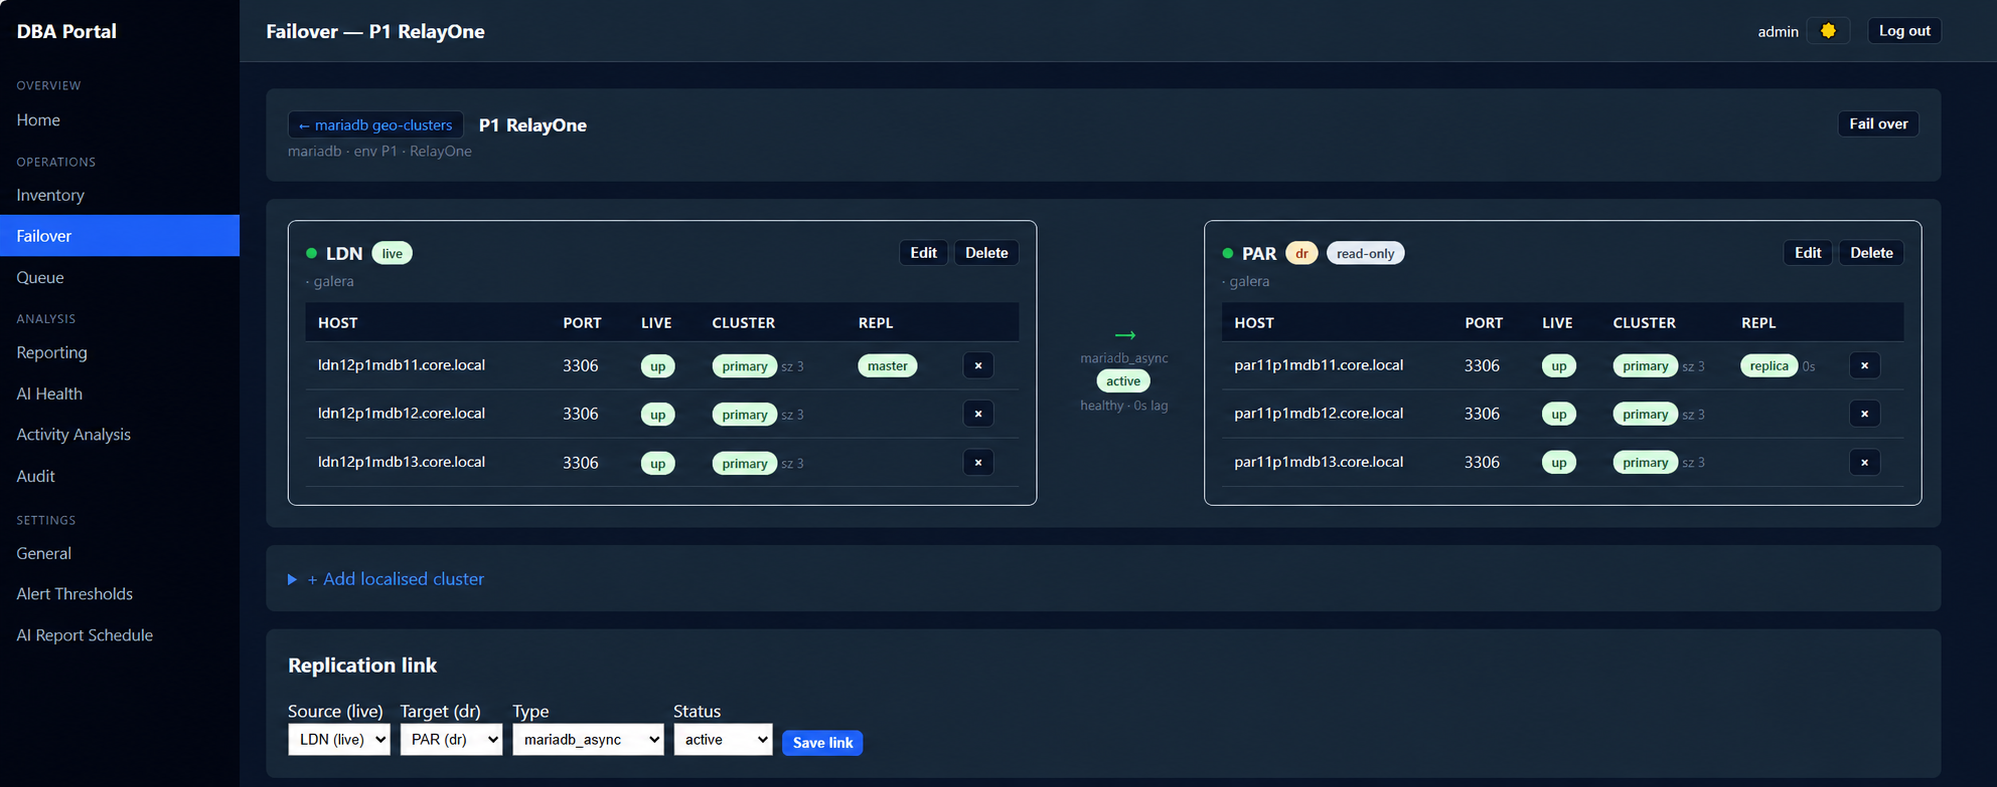
Drilling into one of them is where observation stops. The same page shows cluster members and the replication link between sites, and then offers the action itself.
As this grows, the design needs a clear separation between observation and control, with a shared inventory underneath both:
                    DATABASE ENGINEERING PLATFORM

       OBSERVE                                  CONTROL
          │                                        │
collectors → metrics → dashboards        explicit management action
          │                                        │
          └──────── shared inventory ──────────────┘
                                                   │
                                             queued execution
                                                   │
                                            ownership / audit
The queue semantics that were useful for monitoring become even more important for management actions: work should be claimable once, completion should be attributable to an owner, retries should be deliberate, and actions should be idempotent wherever possible. The natural guardrails for that side of the surface are stronger than those a read-only check needs: explicit permissions, an audit trail, clear action state, bounded retries, and a hard distinction between “inspect” and “change.”
How it was built: my design, AI as the implementation engine§
The platform started as my idea and my implementation plan, and it was built with AI as the implementation engine throughout. That is worth stating plainly, because how the work was done is part of what the work demonstrates.
The order was the same every time, and the order is the whole method:
- Decide what the system has to guarantee. The inventory is the source of truth; a claim has an owner; a stale claim recovers on its own; a label is schema; an endpoint proves itself before it is trusted.
- Write the plan before any code. Decompose the platform into units small enough to describe completely — this collector, this queue transition, this discovery step — each with an explicit acceptance condition.
- Let the model implement the unit. Engine-specific driver code across four engines, exporter plumbing, the portal’s views, refactors and tests: this is work with a known shape, and a fast implementer working against a precise specification is very good at it.
- Review it as though a stranger wrote it, because in the way that matters, one did. Then verify against a real engine, not against a description of one.
What stayed with me was every judgement that a specification cannot be delegated from: the architecture, the consistency boundaries, the blast radius of anything that touches a production database, and the decision about what the system is for.
The result is a delivery speed that would not have been available to one engineer doing operations work at the same time — a multi-engine collector fleet, a coordination layer, a portal, a discovery pipeline and an AI reporting path — without giving up authorship of the design or accepting code into a production path that I could not defend line by line.
There is a symmetry here I did not plan and now think is the point. The discipline that made the build work is the discipline that made the health report work: be specific about what you are asking for, send only what is needed to answer it, and keep the judgement about correctness on the human side of the boundary. Used that way, AI is leverage on an engineer’s plan. Used the other way round, it is a very fast way to generate confident, unowned systems.
Takeaway§
The useful change was not that a dashboard replaced a checklist. It was that a once-daily, person-dependent operating routine became a continuously running system with distributed scheduling, worker ownership, failure recovery, multi-engine collectors, historical metrics and verified onboarding underneath it — and that its output stopped belonging to whoever happened to be on call.
The platform is still evolving, and that is precisely why the architecture matters. The first problem was “how do we stop spending time running the same checks?” The next one is more interesting: how do we turn the same operational knowledge into a safe control plane for the database estate?